How Logging Sized the World
Before big data, there was the humble logbook
 by Joe Honton
Operational metrics should be designed to capture more than just errors and anomalies. Software developers should give internal measurement the attention it deserves.
Clarissa, the founder of Tangled Web Services, opened the Tech Tuesday gathering, "I've invited Capt. Cayman to tell us about Magellan's expedition, and more to the point, about how the world's first circumnavigation was recorded.
"I know this may seem random, but I think you'll find it relevant to our own work in technology. There's more than one lesson in this story."
Capt. Cayman projected an image onto the front wall of the conference room, and began with, "This is the best tribute I know of, to honor one of mankind's greatest exploratory achievements."
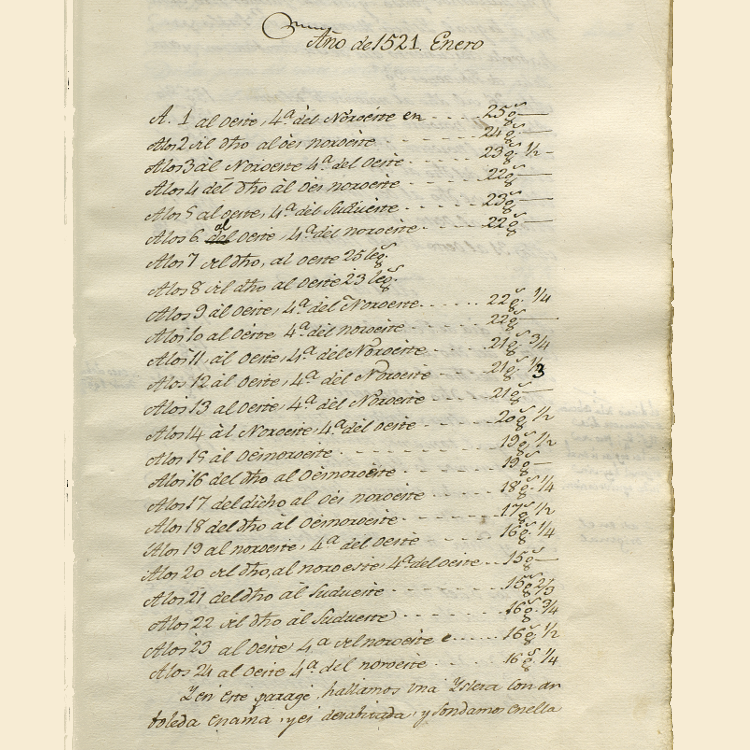
As he paused for effect, the others in the room looked up to see lines of terse abbreviations with unfamiliar words and numbers and dates.
"This is a page from Francisco Alvo's logbook of the fleet's progress across the South Seas in 1521.
For more than three months, the crew saw nothing but the sun, the stars, and the open waters of the Pacific.
Remember, at that time, Earth's size had been greatly underestimated. What they thought would be just a short passage from South America to the Spice Islands, instead became a grueling test of endurance.
Each day of that passage was recorded in the derrotero, the logbook, with entries consisting of the date, the ship's direction, its latitude, and the distance traveled. Because of these entries, the ship's course could be plotted across the vast uncharted expanse, and the size of the Earth determined from empirical data.
Incidentally, not all of this data was easy to obtain.
- The date was of course no problem — as long as the record keeper was diligent.
- The ship's direction could be obtained by averaging the compass readings taken throughout the day.
- And the latitude could be obtained from the sun's noon-time altitude, adjusted for the Earth's current tilt (that is, the day of the year).
But obtaining the distance traveled — and by further calculation, the ship's current longitude — was not easy. It required careful dead reckoning. That was accomplished by throwing a log overboard, paying out the rope that was attached to it, waiting for the sand in the sand-glass to reach its end, hauling in the rope, and counting the number of evenly-spaced knots in the rope that had been payed out. This measurement was taken multiple times a day.
The ship's pilot averaged these measurements, adjusted for what he estimated the water's current speed to be, and recorded the ship's overall speed (in knots) and distance traveled, in the official logbook.
All of these efforts might have seemed superfluous to the operation of the fleet, because in the moment, they provided no relief from monotony, no protection from storms, no estimate of when (if ever) they would reach the end of the ocean. But in the end, it was those very measurements that allowed others to follow in their wake.
Magellan's voyage across the Pacific revealed a major discrepancy in the Earth's size. His careful logging established that the Earth's circumference was actually 5250 kilometers greater than previously thought!
"What does it all mean?" asked Clarissa. "How can we do logging better? How can we make sense out of it all."
"Big data," shouted out someone in the back.
"Machine learning," someone else added.
"Artificial intelligence!"
Then a long pause, as the buzzwords faded in the silence.
"It seems to me," offered Antoní, the team's server analytics guy, "that server logs are like Francisco Alvo's logbook entries. Their value lies in threads, not in averages."
This was met with puzzled looks.
"What I mean is this. When I look at the server logs from our websites, I can easily count averages. How many visitors to each page. What browsers people are using. Mobile versus desktop. Asia versus Europe. Peak visiting hours. These are easy. The value I'm thinking about is in the threads. Conversion ratios. A/B testing. Stuff like that. So we need to do a better job at tracking how people are navigating through our websites. What brought them there? How did they progress from page to page? When did they finally go away?"
"Ah, so analytics, right?" asked Clarissa.
"Analytics, yes, but not just click counts, number of reads, retweets, and all those unhelpful numbers. We need better logging to understand behaviors and motivations, not just actions and reactions.
"I find it ironic that despite the vastness of the waters that surrounded them, Magellan and his crew were under constant threat of dehydration. Sometimes I feel like those sailors — I'm awash in a sea of data but can't find useful information anywhere.
"Here's an example of what needs improvement: marking our log entries with the severity codes info, warning, error, severe. Yikes! Those come straight from the IBM playbook of 1970.
"Why not mark them with categories like invalid for bad user input, logic for programming assertions that failed, security for bad actors attempting to gain entry, devops for network and database failures, or analytics for tracing paths through the system with milestones reached.
"Categories like these could be paired with other values that provide contextual clues to problems in the system, or level of service alerts for NetOps, or A/B flags for marketing, and so on.
"Also, stop limiting logbook entries to just one long text string. Add searchable fields that can be amalgamated and analyzed.
Antoní finished his rant but somehow didn't feel satisfied. Clarissa tried to console him, "Don't take it so seriously, it's not as if the size of the world depends upon it."
Antoní has been busy trying to get it right. Here's his current take on how to Analyze Your Server Logs.
No minifig characters were harmed in the production of this Tangled Web Services episode.
Follow the adventures of Antoní, Bjørne, Clarissa, Devin, Ernesto, Ivana, Ken and the gang as Tangled Web Services boldly goes where tech has gone before.